Spectroscopy
- - August 19, 2024
In the industrial world, hazardous environments pose unique challenges that demand exceptional solutions. From oil refining to paint production, maintaining safety and accuracy in such settings is paramount. Nova Industrial Analytics rises to the occasion with Phoenix EX, offering advanced sensors and analytics designed to overcome these obstacles with unparalleled reliability and precision.
- - June 14, 2020
[by Tiana Riggi]
UV/VIS/NIR absorbance spectroscopy is governed by Beer's Law, where the absorbance signal is proportional to chemical concentration, light path length and the compound’s specific molar absorption coefficient. Typical optical pathlengths of cuvettes and flow cells are between 0.1 cm and 10 cm. Longer pathlengths are difficult to achieve due to mechanical constraints. WPI solved this problem with the LWCC Liquid Waveguide Capillary Cells. LWCCs are fiber optic flow cells that combine an increased optical pathlength range from 10–500 cm with small sample volumes ranging from 2.4 µL to about 3 mL. Compared with a standard 1 cm cell you can expect to achieve a 10-500 fold increase in sensitivity.
Give us a call today to discuss your application.
(866)606-1974 toll-free in the USA
- - May 20, 2020
[by Tiana Ruchti]
When you have exact specifications for your fiber optic assemblies, WPI delivers with proprietary qualified optical fibers designed by in-house optical engineers. You can count on superior performance from WPI's spectroscopy products and the published research scientists who design them. When you depend on reliable data for your discoveries, consider WPI's German Optics Department for qualified optical fiber and assemblies.
Here we discuss the process for submitting a request for an optical fiber to match your needs using the WPI optical fiber selection guide. There are five steps.
...more1. Select your fiber material. You will see in the two charts that there are seven fiber materials available. Two of them are exclusive and new to WPI. Once you’ve discovered what spectral range you are working on and the numerical aperture (NA) that you will need, select the fiber material. 2. Select the style of the optical fiber. To simplify the process, we only show a couple. - - December 19, 2019
The purpose of this article is to describe a new cleaning procedure for thoroughly cleaning WPI flowcells, including Liquid Waveguide Capillary Cells (LWCCs), UltraPath flowcells and optical cuvettes. The image (right) shows a 3000 series LWCC with a MiniStar pump and the LWCC injection system placed on top of it.
Preparation of Chemicals
All chemical reagents should be of at least ACS-Grade, preferably HPLC-Grade. This procedure involves the use of caustic and flammable reagents. Consult the manufacturer’s MSDS for necessary safety precautions.
Cleaning Solution #1:
0.5M Potassium Hydroxide in 100% Ethanol (e.g.: 7 g KOH in 250mL EtOH). After thoroughly mixing, filter the solution through a 20µm pore size filter.
Cleaning Solution #2:
100% Methanol, HPLC grade
Cleaning Solution #3:
Ultrapure water, Type I per ASTM D1193-99 or equivalent
NOTE: Grade 1 ultrapure water per ISO 3696 differs significantly from the above classification.
Cleaning Procedure
The preferred method of cleaning...more - - July 21, 2019
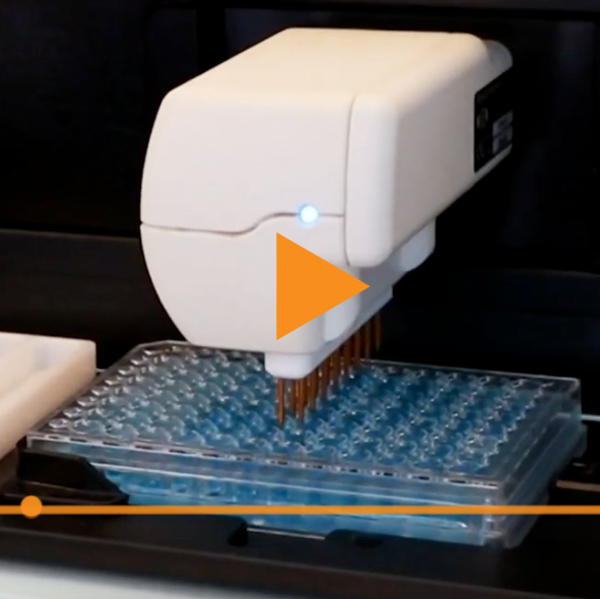
WPI offers custom fiber optic cables and assemblies. This video show how to create a custom ordering code to designate what you need. If you have any questions about ordering Fiber Optic Cables and Assemblies for your laboratory or application, just give us a call (866-606-1974) or email us at wpi@wpiinc.com.
- - May 16, 2019
Optical measurements are important to researchers. Discover today how WPI has contributed with the recent release of Qualified Fiber.
- - February 10, 2019
Not all fibers are created equal. When your research is on the line, the choice is clear. Because,WPI optical fibers are qualified for your next project.
...moreThink of it this way–it is optical fiber that finally addresses the lingering issue of fiber performance variability. Qualified fiber ensures repeatability from one fiber cable to the next. Let me explain. Other attributes of a complete fiber optic sensing system have been addressed to ensure repeatability and accuracy from one system to the next. However, given the nature of working with light especially in the UV and with the process of making multimode UV optical fiber, optical fibers have been a limiting factor for product developers. Historically, this critical component of a system WAS an inherent weakness. Not anymore. WPI provides product developers, and researchers with UV basic attenuation data after manufacturing for starters.
The proprietary formulation of WPI fiber resists UV degradation to allow for deep UV down to 185
- - February 07, 2019
Trusted Partner for Reliable Measurements
WPI is dedicated to being your preferred OEM supplier for optical fiber products by offering the following:
- Quality Products and Expert Service – After over 50 years in business, we’ve learned that it takes more to be your partner than just great quality and fair prices. We have implemented measures such as our ISO-9001:2015 certification throughout our home office and production facility to improve our efficiency and ensure quality. We also have invested in six sigma certifications with continuing effort to improve processes within the organization.
- Personal Service – A dedicated OEM account manager and a seasoned optical engineering team with over 20 years of technical design experience make all the difference for our customers.
- Cost Effective Solutions – Quality optical fiber products at the highest value gives you more confidence for less. Our core values are driven by a desire to empower you to fulfill your scientific ideas.
Proprietary qualified...more
- - October 07, 2018
Measuring CDOM with a Fiber Optic Liquid Waveguide Capillary Cell
One's imagination is the limit with practical uses of WPI's Liquid Wavelength Capillary Cells(LWCC), also referred to in the fiber optic spectroscopy community as a Long Pathlength Flow Cell. This fiber optic sampling accessory for absorbance measurements combines increased optical pathlengths with small sample volumes making them ideal for water analysis such as CDOM.
Two optical fibers couple to this sampling accessory one to send light to the sample cell and the second to send light to a spectrometer. The length of the fiber optic cable can vary allowing investigators to either spot test CDOM in the lab from collected water samples or continuously monitor CDOM of a body of water under investigation with this sampling accessory coupled to a fiber optic spectrometer and source.
What is CDOM?
The optically measurable component of Colored Dissolved Organic Matter. It occurs naturally in water systems and is derived...more
- - June 26, 2017
Absorption of light correlates to the energy of a photon that is taken-up by electrons of the substance atom. The electromagnetic energy is transformed into internal energy of the absorbent substance. The absorbance of a substance quantifies how much of the incident light is absorbed by it (instead of being reflected or refracted). Precise measurements of the absorbance at many wavelengths allow the identification of a substance via absorption spectroscopy, where a sample is illuminated from one side, and the intensity of the light that exits from the sample in every direction is measured (see Fig. 1). A few examples of absorption are ultraviolet–visible (UV-Vis) spectroscopy or infrared (IR) spectroscopy.
- - June 26, 2017
The use of fluorescent probes in cell physiology has emerged as indispensable tool in the analysis of cell functioning over recent years. The physics underlying fluorescence is illustrated by the electronic-state diagram (so-called Jablonski diagram, see Fig. 1), showing the three-stage process to create the fluorescent signal (Excitation - Excited/State Lifetime - Fluorescence Emission) in a fluorophore/indicator and simplified described below.
Fig. 1– Jablonski diagram illustrating the processes of fluorescence by absorption of higher photon energy by a fluorophore and subsequent emission of lower photon energy, resulting in fluorescence during the fluorescence-lifetime.
Fluorescence is obtained when an excitation photon (hνEX) from an external source, such as a high-power LED, is absorbed by a fluorophore that elevates its energy (S1’). During the fluorescence-lifetime, the elevated energy (S1’) decays to a lower energy state S1. Then, fluorescence results in the emission of a photon...more
- - April 30, 2013
Abstract
Concentrations of DNA in solution (31µg/mL and 688µg/mL) were measured with a spectrometer and UV/VIS light source in a DIPUV-Mini. Due to the 2mm pathlength, use of a DIPUV-Mini does not require a pre-measurement dilution within this concentration range, thus a potential source of error was eliminated.
Experimental Procedure
Standard solutions of DNA (Sigma D1626) were prepared gravimetrically using 18.2MΩ/cm ultrapurified water as a solvent. Solutions were prepared between 0.0µg/mL and 687.6µg/mL.
Measurements were taken in triplicate using a DIPUV-Mini. The DIPUV-Mini was connected to a UV/VIS light source (WPI #D4H).
Data were collected in 1nm increments across the full range of the instrument (190nm-720nm). The instrument was configured such that reference measurements yielded an 80% total intensity. All measurements utilized 18.2MΩ/cm ultrapurified water as a reference solution.Results
Experimental results are presented in Table 1:
...moreDNA [µg/mL] Absorbance @260nm - - April 30, 2013
Abstract
Concentrations of DNA in solution (31µg/mL and 561µg/mL) were measured with a spectrometer and UV/Vis light source in a cuvette. A 2mm pathlength
cuvette does not require a pre-measurement dilution within this concentration range, thus a potential source of error was eliminated. Although a 2mm cuvette has a total internal volume of 0.7mL, only 350µL is required to obtain an accurate measurement. Experimental Procedure
Standard solutions of DNA (Sigma D1626) were prepared gravimetrically using 18.2MΩ/cm ultrapurified water as a solvent. Solutions were prepared between 0.0µg/mL and 561.1µg/mL.
Measurements were taken in triplicate using a 2mm cuvette (WPI #CUV2102-1) in a standard cuvette holder. An appropriate cuvette spacer (WPI #89342)allowed for consistent placement of the cuvette within the holder. The cuvette holder was attached via two 500µm SMA-terminated fiber optic cables to a UV/Vis light source (WPI #D4H).
Data were collected in 1nm increments across the full...more
- - April 30, 2013
Cuvettes come in a variety of shapes and sizes, but one of the most important specifications of a cuvette is its Z-dimension. The Z-dimension of an instrument (cuvette holder or spectrometer) is the distance from the bottom of the cuvette chamber floor to the center of its light beam (see image). A cuvette’s Z-dimension must match the Z-dimension of the instrument with which it will be used. Each manufacturer designs its instruments with a specific Z-dimension. Common Z-dimensions include 8.5 and 15mm, and sometimes 20mm. When purchasing small volume cuvettes, the correct Z-dimension becomes critical. Matching the Z-dimension of the cuvette to the Z-dimension of the instrument ensures that the light beam passes through the center of small samples.The table below shows the standard Z-dimension of the spectrometer sample compartments for many manufacturers.
...moreMANUFACTURER
Z-DIMENSION Agilent® 15 mm Avantes® 15 mm Beckman® 8.5 mm Bio-Rad® 8.5 mm Cecil® 15 mm Eppendorf® 8.5
Recent Posts